Root Cause Analysis (RCA): The Problem-Solving Hero
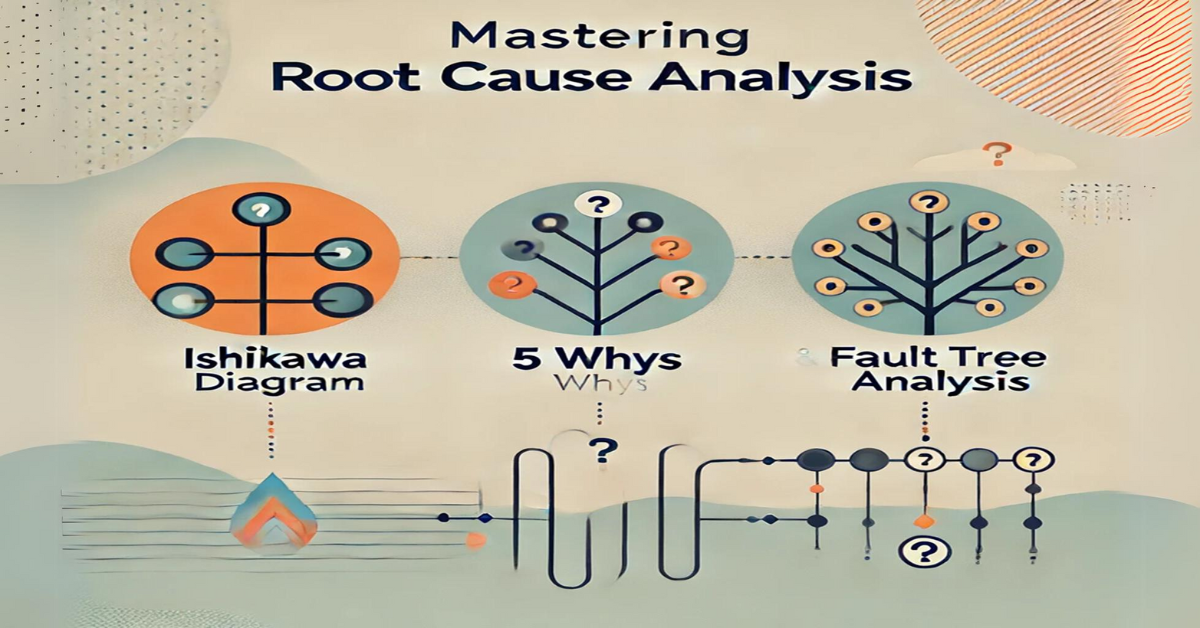
At the heart of BPM’s continuous improvement is Root Cause Analysis (RCA). RCA isn’t just a one-trick pony; it’s a multi-talented suite of strategies including the Ishikawa Diagram, the ‘5 Whys’, and Fault Tree Analysis (FTA). These tools are the sleuths in the business process world, dissecting problems to their core to find solutions that stick.
When and Where to Employ RCA
Don’t wait for trouble to brew before calling on RCA. It’s a proactive force in the BPM cycle, essential during the planning phase for business process improvement. Whether it’s during the initial ‘problem-finding stage or the ‘as-is Analysis’ that examines current workflows, RCA is your go-to for identifying areas ripe for enhancement.
The Ishikawa Diagram: Mapping the Bones of Business Processes
When it comes to RCA, the Ishikawa Diagram stands out as a vital tool. Also known as the ‘fishbone diagram’, it’s the X-ray of the business world, revealing the skeletal structure of complex process issues. This diagram is ingeniously simple: at its head is the problem, and each bone branching out represents potential causes. These branches are typically categorized into six main areas: Machine, Method, Material, Man (Personnel), Measurement, and Environment.
The Origin of the Ishikawa Diagram
The Ishikawa Diagram, also known as the fishbone diagram or cause-and-effect diagram, traces its roots back to the mid-20th century, developed by Kaoru Ishikawa, a prominent Japanese quality control expert. Ishikawa introduced this diagram in the 1960s as a systematic way to analyze industrial processes and identify quality issues.
Kaoru Ishikawa: The Pioneer
Kaoru Ishikawa believed that organizational improvement could be achieved by providing workers with the proper tools to identify quality problems. His vision was to democratize quality control and involve all levels of a company in the process.
The Diagram’s Impact on Quality Control
The Ishikawa Diagram quickly became a staple in the Total Quality Management (TQM) movement. It stood out for its ability to categorize and visualize the causes of a particular problem, which was revolutionary in the quality control field. This visualization made complex issues understandable and accessible to all employees, not just experts.
Fishbone Diagram: A Symbol of Collective Analysis
The ‘fishbone’ structure of the diagram symbolizes the collective breakdown of contributing factors to a problem. Each ‘bone’ represents a different category of root causes, which Ishikawa originally identified as ‘the 6 Ms’ in a manufacturing context: Machine, Method, Material, Man (Personnel), Measurement, and Environment.
Legacy of the Ishikawa Diagram
Ishikawa’s legacy lies in the lasting influence of his diagram across industries worldwide. It’s been adapted for service industries, software development, healthcare, and more, proving its versatility and effectiveness in various contexts beyond its manufacturing origins.
How It Works
The Ishikawa Diagram operates on a brainstorming foundation. Teams gather around and identify as many potential factors contributing to a problem as possible. These factors are then placed into the relevant categories on the diagram, prompting a visual investigation that leads to ‘aha!’ moments.
Application in BPM
Within BPM, the Ishikawa Diagram is more than just a tool for identifying what’s going wrong. It’s a catalyst for team collaboration and a visual aid that makes complex problems less intimidating. When process issues are laid out clearly, it’s easier to trace back through each factor to the root causes.
The Benefit to Business Processes
Implementing the Ishikawa Diagram can dramatically improve problem-solving efficiency. By visually organizing causes of defects, inefficiencies, or failures, businesses can pinpoint areas in need of improvement and take corrective actions that are both effective and systemic.
A Tool for All
What’s most compelling about the Ishikawa Diagram is its versatility. It’s not industry-specific or limited to certain types of problems. Whether it’s a delay in delivery times, a decline in product quality, or an internal workflow hiccup, the fishbone diagram is your go-to for dissecting and understanding the problem at hand.
Wrap-Up
Incorporating the Ishikawa Diagram into your BPM toolbox can streamline your processes, foster a collaborative problem-solving environment, and ultimately, drive your business toward leaner operations and improved outcomes. The clarity and direction it provides make it an indispensable component of any process improvement initiative.
Tools for Implementing Ishikawa Diagrams
When it comes to bringing the Ishikawa Diagram to life, there’s a plethora of tools at your disposal, ranging from free applications to premium software suites. Each offers unique features to accommodate the varying needs of businesses and professionals.
Free Tools
Lucidchart: With a robust free version, Lucidchart allows users to create basic fishbone diagrams easily. It’s web-based, facilitating collaboration across teams in real time.
Draw.io (now diagrams.net): This free, open-source diagramming tool is perfect for those needing a straightforward way to create fishbone diagrams without any frills.
Canva: Known for its design capabilities, Canva offers free templates for creating simple Ishikawa Diagrams that are visually appealing.
Paid Tools
Minitab: Minitab isn’t just for statistical analysis; it’s also equipped with quality tools, including the ability to create detailed Ishikawa Diagrams. It’s ideal for those who need to integrate their RCA with statistical data.
SmartDraw: This tool offers advanced diagramming capabilities, including fishbone diagrams, and integrates with other enterprise tools like Microsoft Office, Google Apps, Jira, and more.
iGrafx: A comprehensive business transformation platform, iGrafx provides the ability to create Ishikawa Diagrams within the context of larger business process modeling and improvement efforts.
Choosing the Right Tool
The choice of tool depends on your specific needs:
For simplicity and cost-effectiveness, free tools might be sufficient, especially for small teams or infrequent use.
For integration with broader business processes, data analytics, and enterprise-wide collaboration, investing in a paid tool might be the right call.
Regardless of the tool chosen, the fundamental objective remains the same: to use the Ishikawa Diagram to identify, analyze, and resolve issues within business processes efficiently and effectively.
The 5 Whys Technique: Peeling Back the Layers of Process Issues
Diving into the root of a business problem doesn’t have to be complex. Enter the 5 Whys technique: a disarmingly simple yet powerful tool used in BPM to drill down to the essence of an issue. The method involves asking ‘Why?’ five times (or as many as needed) to move past symptoms and reach the underlying cause.
The Origin of the 5 Whys Technique
The 5 Whys technique is a cornerstone of problem-solving methodologies and stands as a testament to the power of simplicity in the face of complex challenges. Its inception is attributed to Sakichi Toyoda, the founder of Toyota Industries, and it was further developed within the Toyota Motor Corporation during the evolution of its manufacturing methodologies.
Sakichi Toyoda: The Inventor
Sakichi Toyoda, an influential figure in Japan’s industrial growth, emphasized the need for underlying causes to be discovered through iterative questioning. The method was formalized and integrated into Toyota’s Problem Solving Process in the 1950s and is considered an integral part of the Toyota Production System (TPS), which gave birth to Lean Manufacturing.
See: ‘Toyota Production System: Beyond Large-Scale Production’ by Taiichi Ohno, which is a key resource in understanding various Toyota methodologies, including the development of the 5 Whys technique. Taiichi Ohno, one of the architects of the Toyota Production System, provides insights into the principles and practices of Toyota’s production methods. The ISBN for this book is 978-0915299140.
This book details the philosophy and implementation of the techniques that have made Toyota a leading global manufacturer, including the process of asking ‘why’ multiple times to reach the root cause of manufacturing problems, a practice developed under Sakichi Toyoda and promoted by Taiichi Ohno within Toyota’s manufacturing process.
5 Whys and Its Role in Lean Manufacturing
Lean manufacturing focuses on the elimination of waste and optimization of processes. The 5 Whys technique provided a straightforward approach to identify non-value-adding elements and ensure that production processes were as efficient as possible.
Beyond Manufacturing: A Universal Problem-Solving Tool
While the 5 Whys was conceived within the manufacturing industry, its application has broadened far beyond its origins. Today, it’s used in business management, software development, healthcare, education, and various other sectors that require a methodical approach to problem identification and solution.
The Evolution of the Technique
The simplicity of the 5 Whys has allowed it to evolve over time. It has been combined with other tools, such as the Ishikawa Diagram, to provide a more comprehensive analysis of problems. It also laid the groundwork for various other root cause analysis methods.
The 5 Whys technique’s humble beginnings within the automotive industry showcase its timeless relevance in problem-solving. Understanding its origin helps professionals appreciate the historical context and encourages its application in modern-day business process management as a means to drive continuous improvement.
How the 5 Whys Works
The process begins with a problem statement. You then ask ‘Why?’ to uncover the first layer of reason, which often reveals another issue. You continue this process of inquiry, layer by layer, until you reach the fundamental root cause. This iterative interrogation leads to insights that might otherwise be overlooked.
Application in BPM
In the context of BPM, the 5 Whys acts as a scalpel, cutting through the complexities of business processes to reveal the simplest paths to solutions. It aligns perfectly with lean management philosophies, aiming to minimize waste and maximize value through clear, concise problem-solving.
Tools for Implementing the 5 Whys
While the 5 Whys can be conducted with nothing more than a piece of paper, there are tools available to guide and document the process:
Free Tools
Google Docs: A simple shared document can be a surprisingly effective tool for collaborative 5 Whys sessions. It’s free and allows for real-time team participation.
Trello: Use this free project management app to organize thoughts and track the progression of each ‘Why?’ in a visual format, creating a clear trail from problem to root cause.
Paid Tools
MindMeister: This mind mapping tool isn’t just for brainstorming; it can be adapted for 5 Whys analysis, visually tracking the path from each question to the next.
Cause Mapping Template in Excel: For those who prefer structured data, Excel templates are available for purchase that are designed specifically for root cause analysis, including the 5 Whys.
Choosing the Right Tool
The key to selecting the right tool is to consider your team’s collaboration style and your company’s documentation needs. Free tools can be incredibly effective, especially for smaller teams or less complex issues. However, for organizations seeking more robust tracking and integration with other BPM tools, investing in a paid solution may yield better results.
Fault Tree Analysis (FTA): Dissecting Problems to Their Core
Fault Tree Analysis (FTA) is a powerful and systematic tool used in risk assessment and system reliability engineering to identify potential causes of system failures before they occur. It uses a graphical representation of the various intersecting pathways that can lead to a particular fault or failure.
The Origin of Fault Tree Analysis
The development of Fault Tree Analysis dates back to the 1960s, with its origins tied to the U.S. aerospace sector.
The Bell Telephone Laboratories Creation
FTA was originally developed by Bell Telephone Laboratories to assist with the launch control systems of the Minuteman I intercontinental ballistic missile system. The methodology was created to ensure the reliability and safety of the complex systems involved in launching the missiles.
FTA’s Role in Safety and Reliability Engineering
Since its inception for aerospace applications, FTA has expanded into numerous industries as a critical method for analyzing system failures and improving safety. Its application includes nuclear power, chemical process industries, and more recently, in healthcare and software engineering.
The Legacy of FTA
The legacy of FTA lies in its structured approach to identifying and analyzing the probabilities of various failures, which has made it an indispensable tool for engineers and managers tasked with ensuring the reliability and safety of complex systems.
How Fault Tree Analysis (FTA) Works
Fault Tree Analysis is akin to a systematic detective story for engineers and managers. It’s about constructing a logic diagram that models the various intersecting pathways that could potentially lead to a system failure.
The Logic Behind FTA
The process begins by identifying one specific undesired event, known as the ‘top event,’ which the analysis will focus on. From there, FTA uses a top-down approach, working backward from the top event to identify all possible causes and their interrelations using logic gates (AND, OR, NOT).
Building the Tree
The branches of the fault tree represent the logical connections between the potential causes of system failures. The root causes at the bottom are the basic events or conditions, and these are connected by intermediate events that eventually lead up to the top event. The primary symbols, or ‘gates’, used in an FTA are:
OR Gate: Indicates that the top event occurs if any of the input events occur.
AND Gate: Indicates that the top event occurs only if all of the input events occur simultaneously.
Quantitative vs. Qualitative Analysis
FTA can be used qualitatively to understand the relationship between different causes or quantitatively by assigning probabilities to the failures, thus calculating the overall likelihood of the top event.
Application of FTA in BPM
Fault Tree Analysis, primarily known for its use in safety-critical fields, also offers substantial benefits within the realm of Business Process Management.
Identifying Process Vulnerabilities
In BPM, FTA can be used to identify vulnerabilities within business processes. It allows organizations to systematically identify the potential for process failure and implement preventive measures.
Enhancing Risk Management
By analyzing the potential causes of failure within business processes, FTA aids in risk management. This anticipatory approach ensures that business operations can be safeguarded against disruptions.
Integration with BPM Tools
FTA can be integrated into BPM software to provide an additional layer of analysis, ensuring that processes are not only efficient but also resilient against possible points of failure.
Informed Decision-Making
Organizations can use FTA to make more informed decisions about where to allocate resources to improve process reliability and to prioritize corrective actions based on the likelihood and impact of potential failures.
By understanding how FTA works and its application in BPM, professionals can leverage this rigorous analytical tool to enhance process reliability and risk management in their organizations.
Tools for Implementing FTA
To conduct an FTA, practitioners can utilize a range of tools, from basic diagramming software to specialized reliability analysis programs:
Free Tools
XMind: XMind offers free basic mind mapping features that can be adapted for FTA, allowing users to create fault tree diagrams with ease.
FreeMind: As an open-source mind-mapping tool, FreeMind allows for the construction of hierarchical diagrams, suitable for simple fault tree analyses.
Paid Tools
ReliaSoft BlockSim: This is a comprehensive suite for reliability, availability, maintainability, and related analyses, including sophisticated FTA capabilities.
Isograph’s FaultTree+: Part of the Reliability Workbench, FaultTree+ is a dedicated software for performing detailed fault tree analysis, supporting both qualitative and quantitative analysis.
Choosing the Right Tool
When it comes to FTA, the choice of tool often depends on the complexity of the analysis required. Free tools may suffice for straightforward, qualitative analyses. However, for a more in-depth, quantitative analysis, especially in critical systems where failure can result in significant consequences, specialized paid software can offer a level of detail and analysis robustness that free tools cannot.
The Convergence of Management Practices
Regardless of your management flavor, the principles of BPM are universal. RCA is the common thread that ties various management practices together, ensuring that the pursuit of process perfection is not just a solitary journey but a unified mission across the management spectrum.
The Professional Value of RCA Knowledge
Understanding RCA is more than a problem-solver; it’s a value booster for any professional. It arms you with the knowledge to not only spot problems but also understand their origins, empowering you to make informed decisions that enhance process efficiency.
Conclusion
This is just a glimpse of the power of RCA within BPM. To truly harness this power and transform your business processes, consider diving deeper. Enroll in BPM Fast Mode Courses for a comprehensive understanding that can propel your career and organization forward. Make the leap from understanding to mastering BPM and become the process champion your company needs.